
To the Top of League of Legend — LOL Match Prediction and Champion Clustering
Introduction
League of Legends is a PC-side MOBA game that is popular all over the world. Similar to many MOBA games, players can accumulate levels and money by killing monsters, minions and opponent heroes in the game, and finally winning the game by destroying the enemy base. Players can get satisfaction through various operations in the game. The outcome of the game is the result that every player cares about.
This game not only has a mass user base but also develops rich chains which contain tremendous business value (Yim, 2019). The professional competitions take place all over the world every year with a cornucopia of regional leagues including LCS, LEC, LCK, LPL, etc. The winners of the competition could receive up to millions of dollars. Besides, there are also various betting companies or live stream activities closely following the detailed results of each competition. The outstanding teams or players also attract various advertisement endorsement and commercial activities.Therefore, analysing the matches data to understand this game more, providing suggestions in champions selections and even predict the outcome at an early stage could create great value.
Riot Games, who has developed and released LOL in 2009, summarizes all 152 champions into 6 categories: Tank, Mage, Marksman, Assassin, Fighter and Support(Champions - League of Legends, n.d.). In this project, we want to dig deeper into clustering champions based on their performance in a professional match, and provide valuable insights by suggesting champions selection and predicting games results.
Data
Data Description
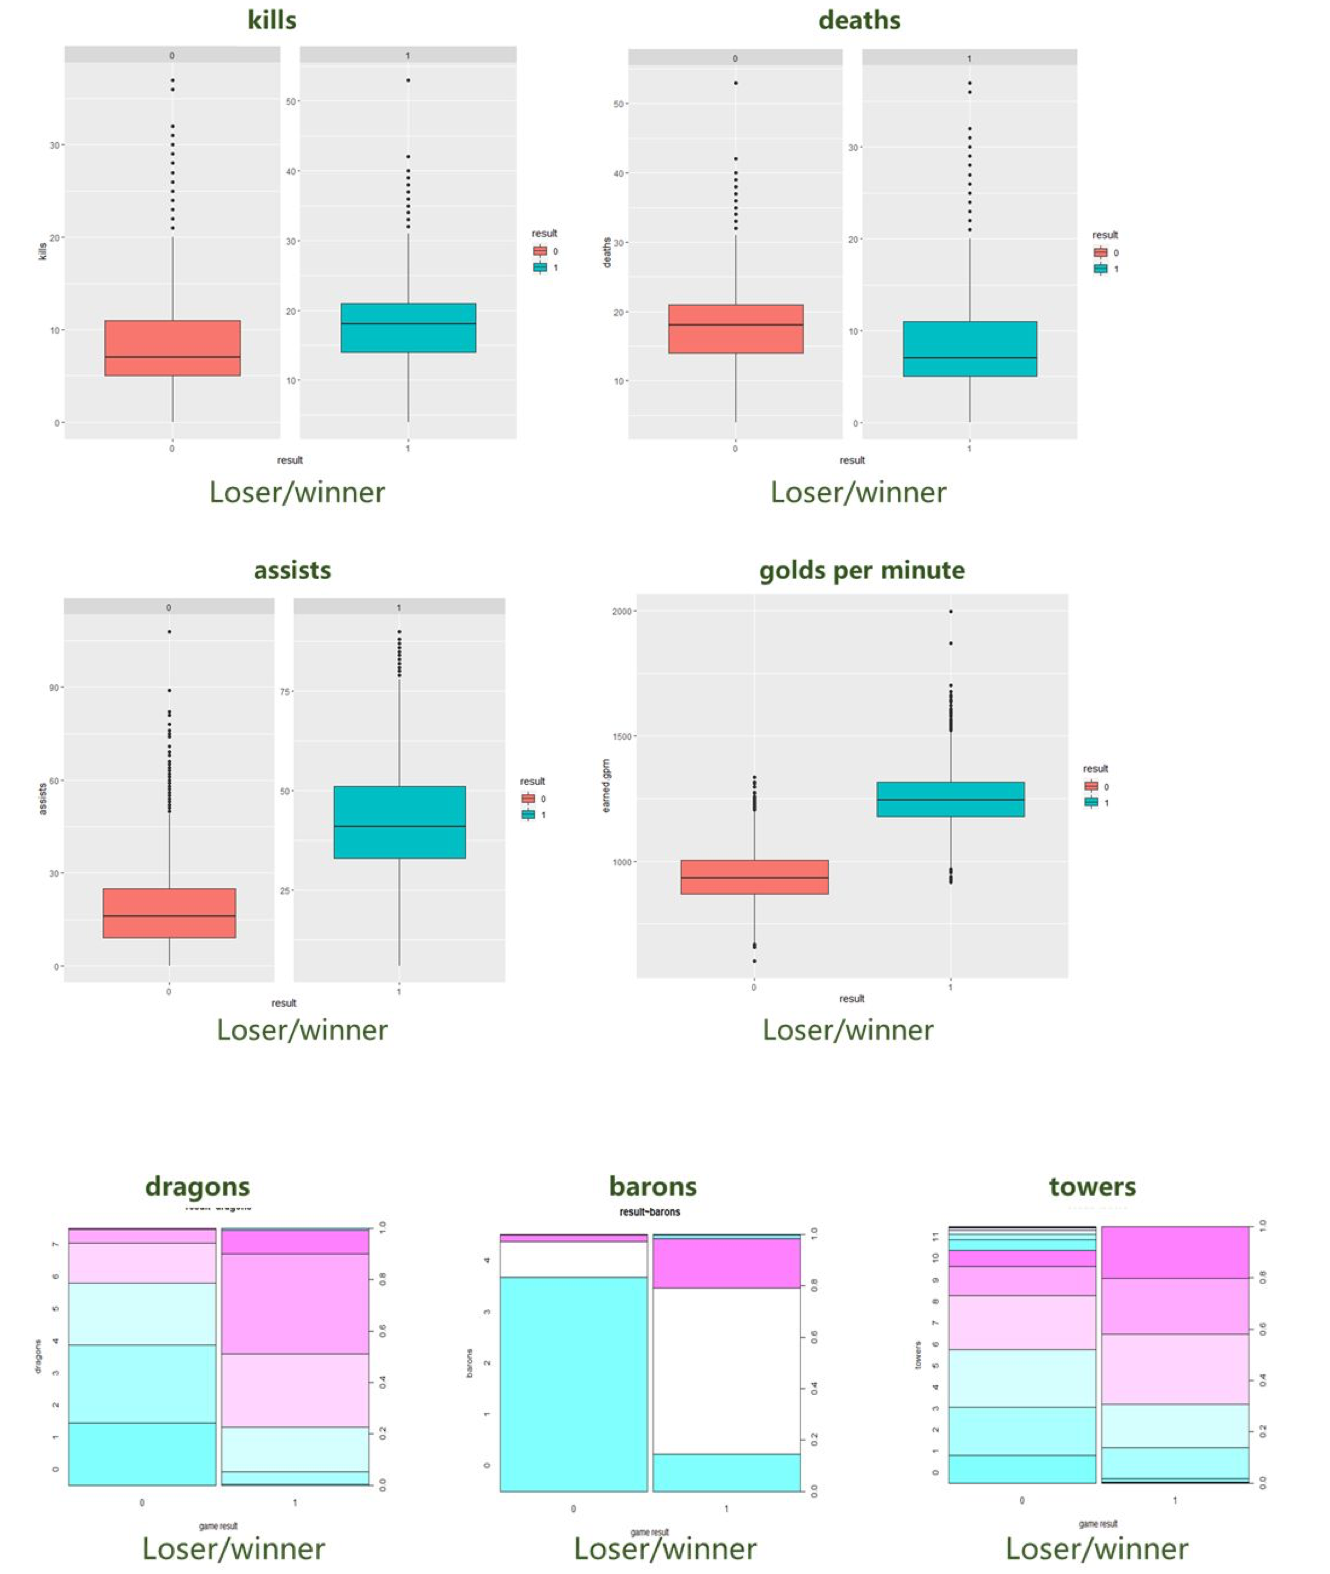
The datasets we used include in-game features for all professional games during 2014 to 2020. It contains individual level performance features like gold difference, experience, creep score, vision score, kill, assist, etc. The data also include features for the player that is in the same position on the enemy team. More specifically, we pick all professional match data in 2020 because of timeliness - the game and champions might change after updates and new versions. This dataset contains 77424 rows with 105 columns. Each 12 rows indicates 1 match (10 player-level data & 2 team-level data). More dataset descriptions and figures are shown below.
Data Preprocessing
Before working on the data, cleaning on the dataset is a crucial step to avoid errors. First, we add game id for matches that are NA in this feature. Second, we divide the original data into two parts: team-level and champion-level datas. We would use team-level dataset for predicting results, and use champion-level dataset for clustering.
For the team-level dataset, two matching teams are combined into one row of data containing features from both teams. Non-numerical and collinear features(for example, gold difference is linear related to the gold of two teams) are removed. After data preprocessing we come to 6369 rows with 102 columns. In the champion-level dataset, we calculate the average of features for every champion in its winning and losing situations. Thus, we can cluster champions based on their performance in different match results.
Champions Clustering
With the data of each person, including the champions they chose and their performance, we tried to clustering the champions for further prediction. We firstly decomposed the features using the PCA method. Grouping by champion and getting the mean of every feature, we got the 54 features for each champion. Further, we split the whole data into the “win” and “loss” part to see how these champions performed in win or loss games. Thus, we got total 108(54 x 2) features for each champion and did PCA based on this dataset.
Letting the cumulative proportion of variance explained go over 90%, we chose 4 principle components, and the final cumulative var explained is 94.05%. We have loadings of the four factors as below:
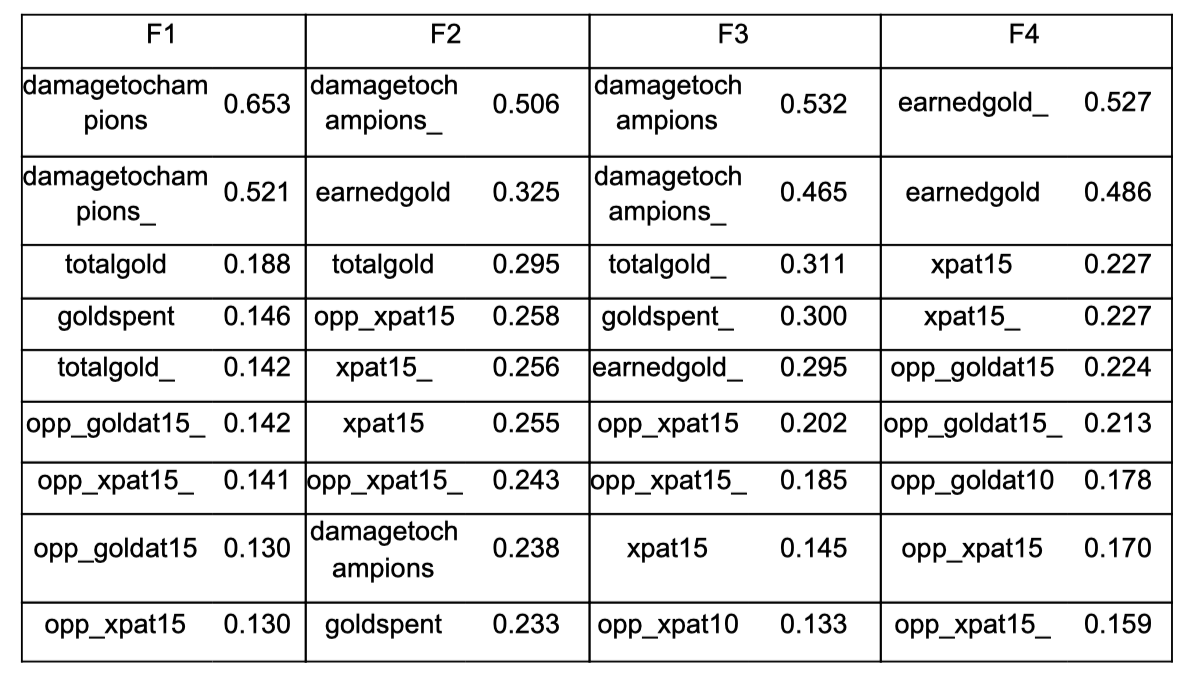
We see that the four factors all have similar weights on the win or loss dataset. Some might have the opposite effect on the two dataset. To give a definition for the four factors, we checked the top 20 largest coefficients for each factor. The first principal component F1 has relatively higher weight on “damage to champions”, which can be defined as a “damage” factor. F2 shows great impact from xpat15(average experience difference at 15 minutes), total gold and earner gold. So it can be defined as a “economy-experience” factor. For F3, we see that it also has high weight on damage to champions, but the impact is converse on win or loss set. F3 can then be seen as a “win-loss diff” factor. Compared with the other 3 factors, F4 has more weight on opp’s features, like opp_gold and opp_xpat. Thus F4 denotes the enemy factor. We should be specific that these definitions are just based on the relative difference between all four factors, but they all have some common characters. Like, all of the factors show great importance of damage-related features.
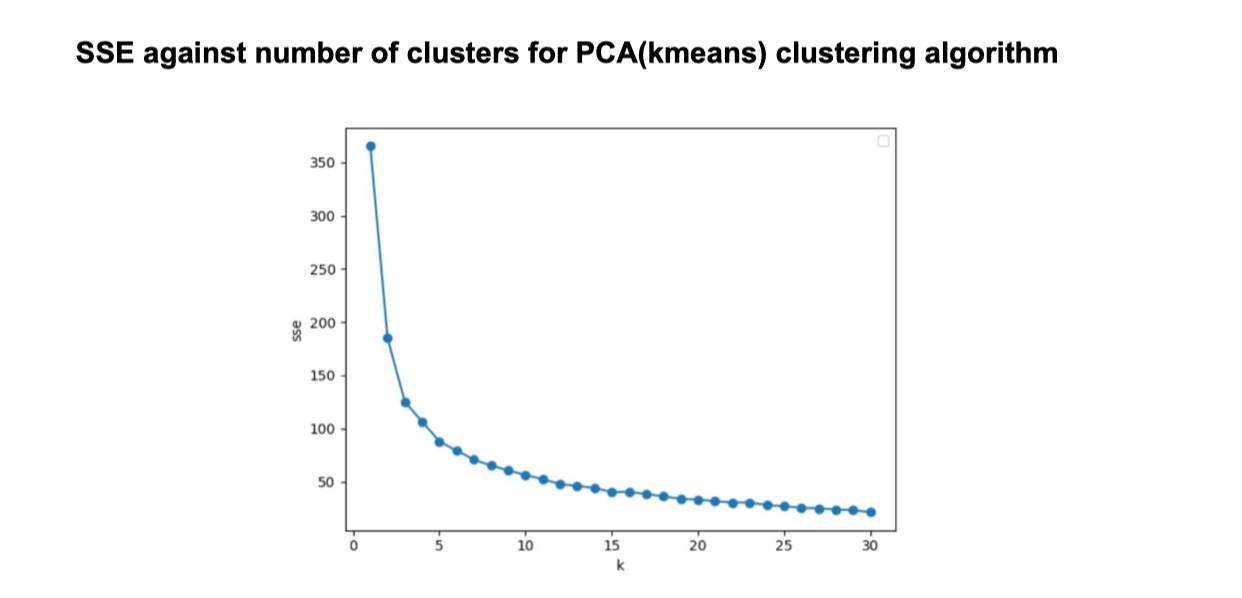
Based on the elbow method we could roughly determine the best number of clusters is equal to 10. However, as League of Legend owns about 150 champions in total, there will be too many champions in one cluster if we just divide them into 10 groups and thus losing parts of strategic insights - LOL has 5 different positions (TOP, JNG, MID, ADC, SUP) separated already. For our model later, we choose the best k (the number of clusters) to be 20.

Prediction Model
Game Result Prediction Based on In-game Features
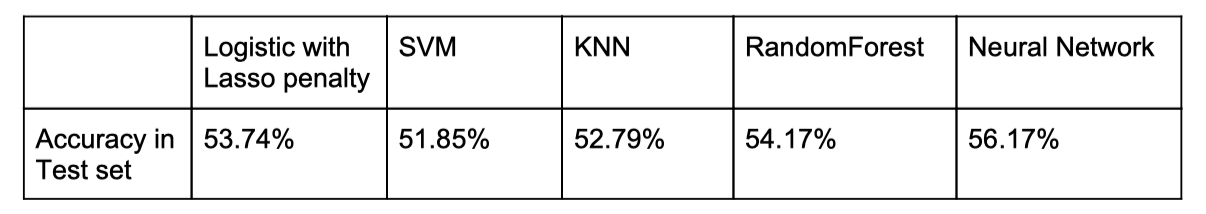
We use several supervised classification models including logistic regression, random forest, SVM and neural network to predict which team would win.
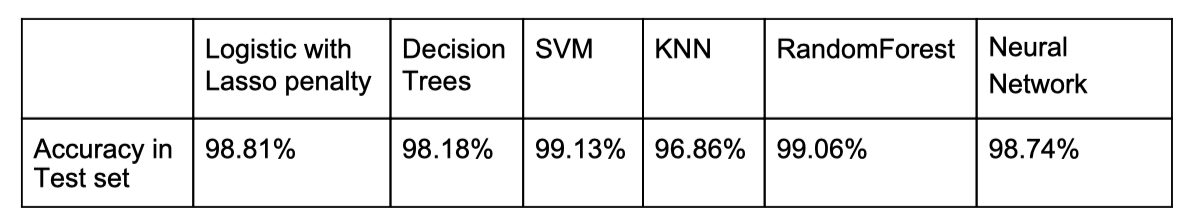
We notice that the overall accuracy is very high. It is not surprising to see such a high prediction accuracy since some features are collected at the end of the game, which have already indicated which team would win. One feature that shows up huge in both logistic regression and tree-based models is the earned gold per minute. During a game, a team with advantage would try to keep the enemy team away from minions and objects, preventing them from obtaining money and buffs. As a result, the team that falls behind is typically getting more and more difficult to come back behind. This is called “snowballing” in League of Legends. Therefore, winning teams, in most cases, are earning gold faster than the teams behind. There are some other features that also have a very strong predicting power of the result, but can only be measured in late game, including the number of Barons, Elder Dragons and inhibitors that a team takes. Teams that obtain more powerful objects are always more likely to find their path towards winning.
Game Result Prediction Based on Champions Clusterings
We also apply the clusters we found using PCA to form features and create new predicting models. Using the results of the clustering algorithm, we create a one-hot 21 length vector for every champion. For each team we sum its vectors, then we concatenate two vectors of the matching teams. Using the 42-length vectors as input, we get the following result:
The results are just slightly better than guessing randomly. There could be several ways to improve the models, including finding better cluster numbers and applying weights to the features in clustering.
Recommendation and Insight
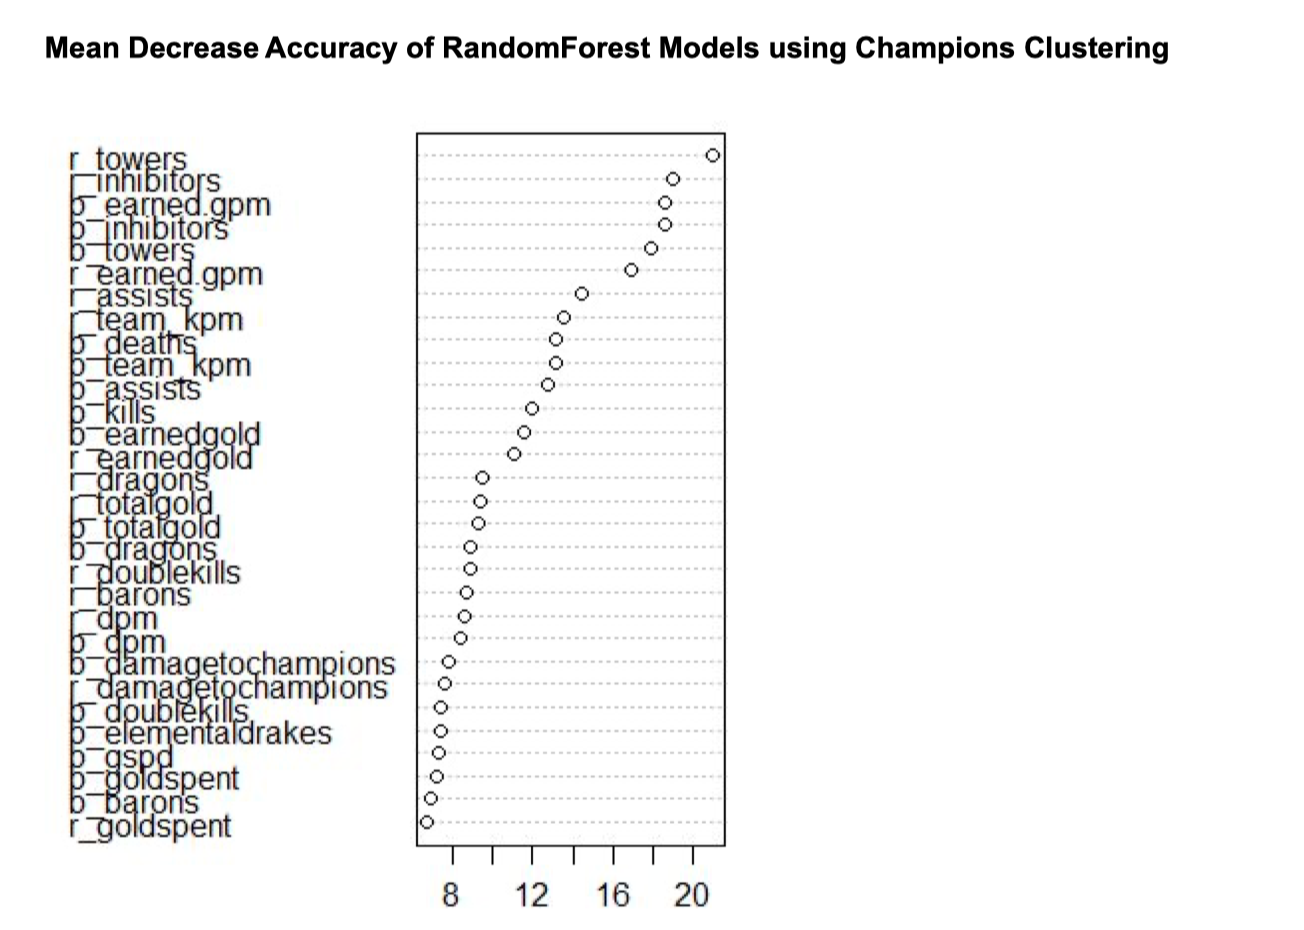
Given the in-game data such as kills, deaths, gold and other resources, we get a significantly high accuracy in predicting the win-loss result. As stated before, it is because these features are mostly collected after the game, and some indicators, such as dragon, towels and barons are the ones that can largely influence the game result. Therefore, the accuracy might not be our key focus in the prediction model, especially using the data collected after the match ended. Nevertheless, we can still get the important information from the feature importance obtained from the Random Forest model. The resources, such as towers, inhibitors, golds, KDA, dragons, are the most significant ones that could affect the game result. But still, for E-sport, just like the traditional sport events such as basketball and football, though we might know which resources are the important ones, it is hard to predict players’ in-game status and performance, and that’s one of the reasons why sport is so charming - uncertainty.
For the 21 clusters separated by principal component analysis, we would like to find out the restraint relationship between each cluster. In other words, for the blue side and red side, if the opponent chooses a champion from one cluster, how can the team maximize the chance of winning by picking the natural enemy from another (or same) cluster. As we have 21 clusters and two teams, the number of total combinations is 21^2 = 441 possibilities. And for each side, we demonstrate the combination of the top 5 winning rates.
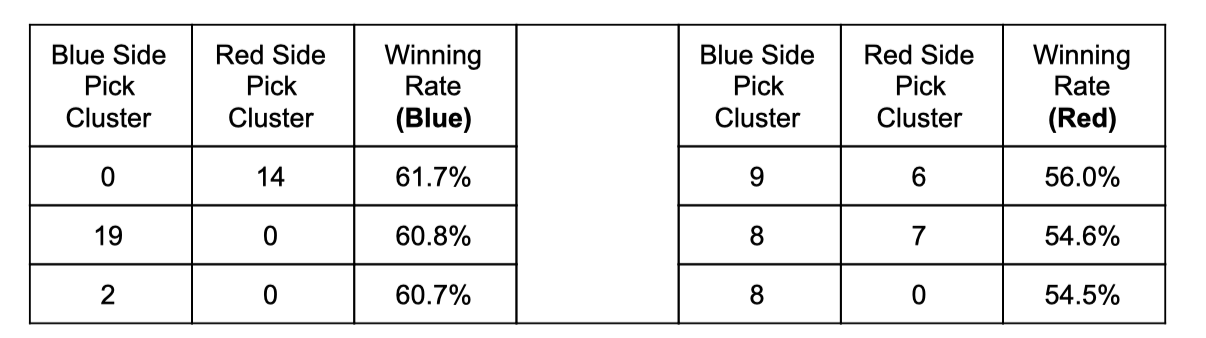
Take a deeper look into the clusters, it makes more sense from the perspective of champions characteristic and positioning. For example, for the blue side if the opponent picks one champion from cluster 14 (‘Gangplank’ ‘Evelynn’ ‘Azir’ ‘Lillia’ ‘Zed’ ‘Kayle’), it is better we have one champion from cluster 0 (‘Senna’ ‘Twitch’ ‘Jinx’ ‘Taliyah’ ‘Vayne’). As the cluster 14 contains the champions who have high Damage Per Second (DPS) that can eliminate other’s ADC (Attack Damage Carry) champion instantly. However, the champions in cluster 0 are most of the ADC with self-protected skills. On the other hand, it is not a wise choice if the blue side picks a champion from the same cluster as it will only lower down the chance of winning.
The clustering result could also provide more insights in the ban & pick process. When the teams choose their champions, there might be the possibility of the desired ones being banned or picked by other teams. The clustering demonstrates several interesting characteristics of certain champions. For example, Tristana, which is tagged as a Marksman according to Riot, is performing more similar to many Fighters in cluster 2, rather than other Marksman in cluster 0,7 and 11. Tristana’s skill sets can deal a huge amount of damage to towers in a very short time, and at the same time she has skills to quickly escape. Thus, she can perform like a solo-lane champion like the others in cluster 2 who keeps pushing the lane, and destroying towers, while other Marksman would prefer to stay with support and farm safely. Another example is Soraka, which is widely treated as a Support that should stay at the back of the team and heal teammates, is clustered with other Supports that frequently use skills to deal damage like Karma, Bard, Lux and Morgana. This indicates that Soraka can be used in an aggressive style. The clustering reveals some characteristics of the champions that are different from the Riot’s labels as well as players’ normal intuition, and provides new champions selections in certain positions.
In conclusion, this project determines some of the most valuable indicators of winning a League of Legends professional game. Besides, all champions in professional games are clustered into 21 clusters, which reveals some hidden characteristics of the champions and can be used during champions picks and ban. Cluster information is also used to build models to predict the result of games based on champions selection. Several further improvements can be made. First, there are many efforts that can be done to improve the clustering algorithm, including using other clustering methods like K-Means, assigning weights to features and finding a better total number of clusters. Second, more features can be added, like basic statistics of champions’ attack, armor, etc.
Reference
Champions - League of Legends. (n.d.). Retrieved December 7, 2020, from (https://na.leagueoflegends.com/en-us/champions/)
Kim, S. J. (2020, April 18). Match Prediction in League of Legends Using Vanilla Deep Neural Network. Towards Data Science. (https://towardsdatascience.com/match-prediction-in-league-of-legends-using-vanilla-deep-n) eural-network-7cadc6fce7dd
Yim, M. (2019, November 18). People are investing millions into League of Legends franchises. Will the bet pay off? The Washington Post. (https://www.washingtonpost.com/video-games/esports/2019/11/18/people-are-investing-mill ions-into-league-legends-franchises-will-bet-pay-off/)
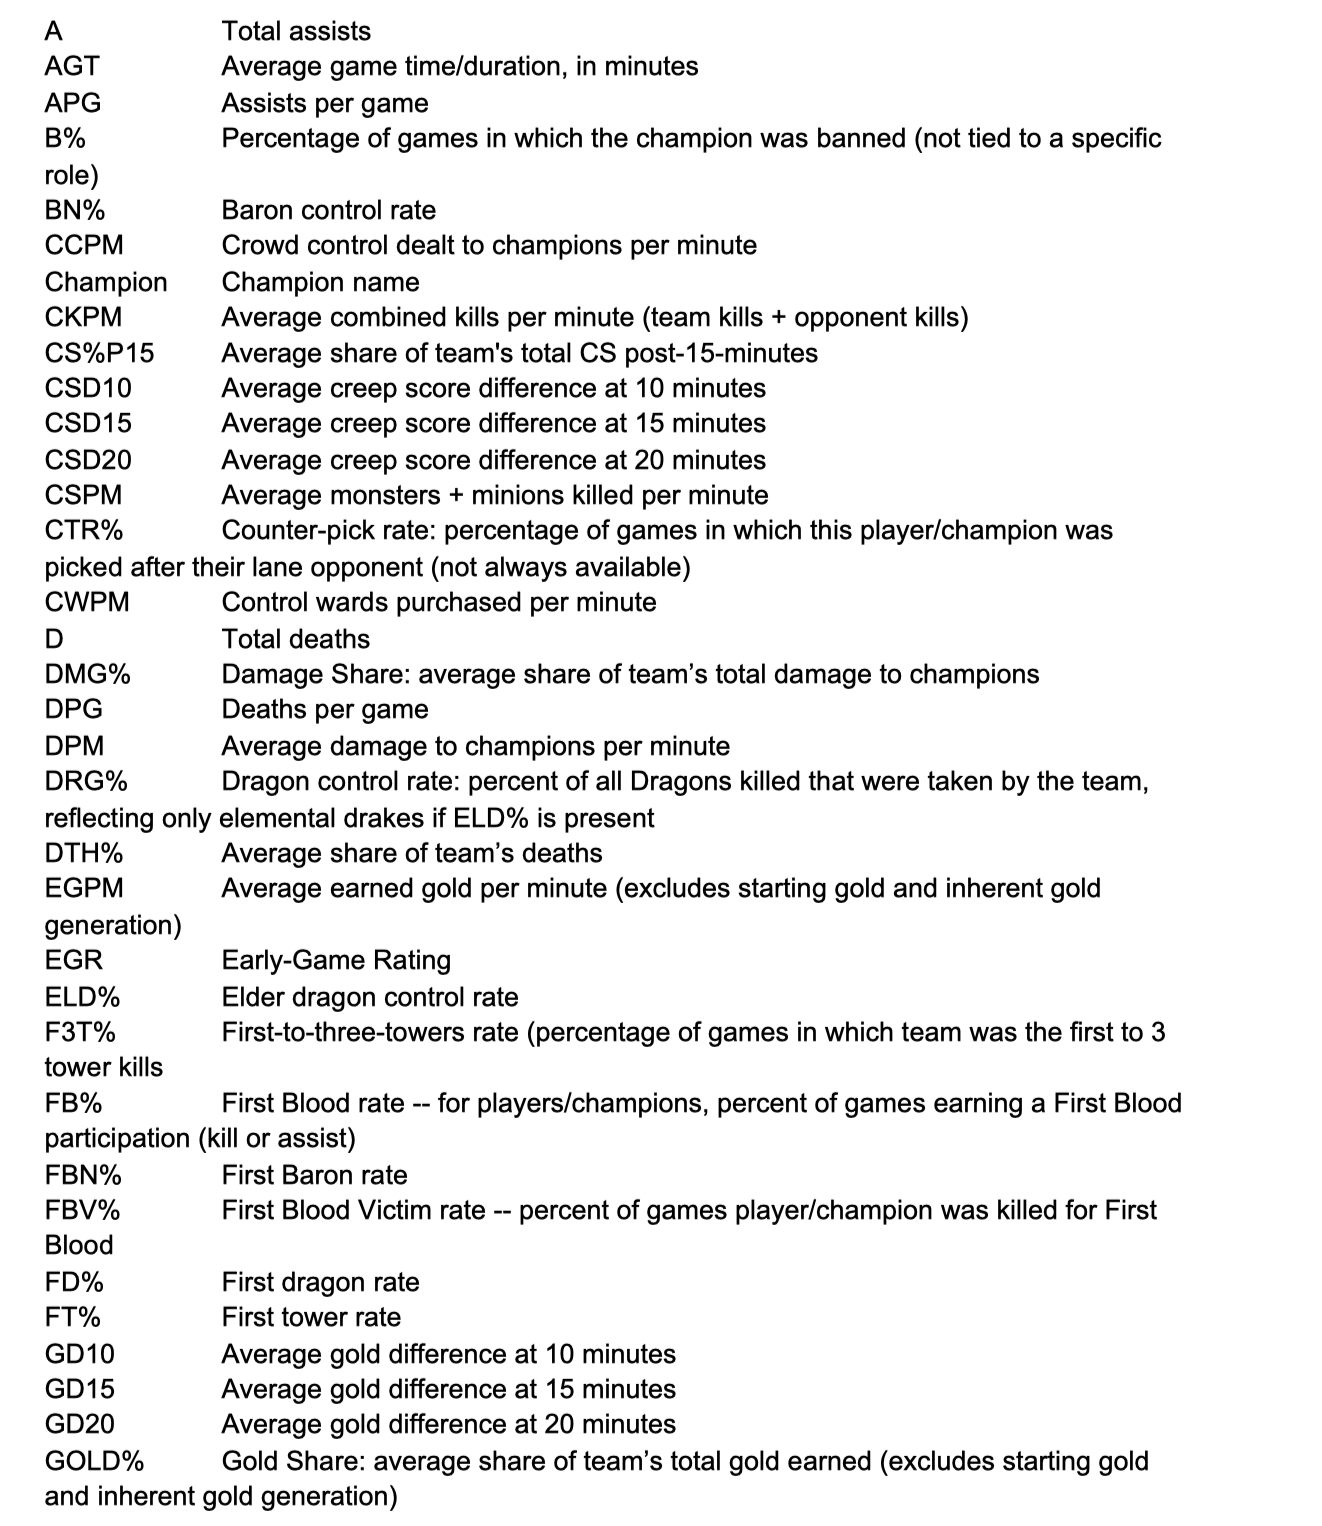
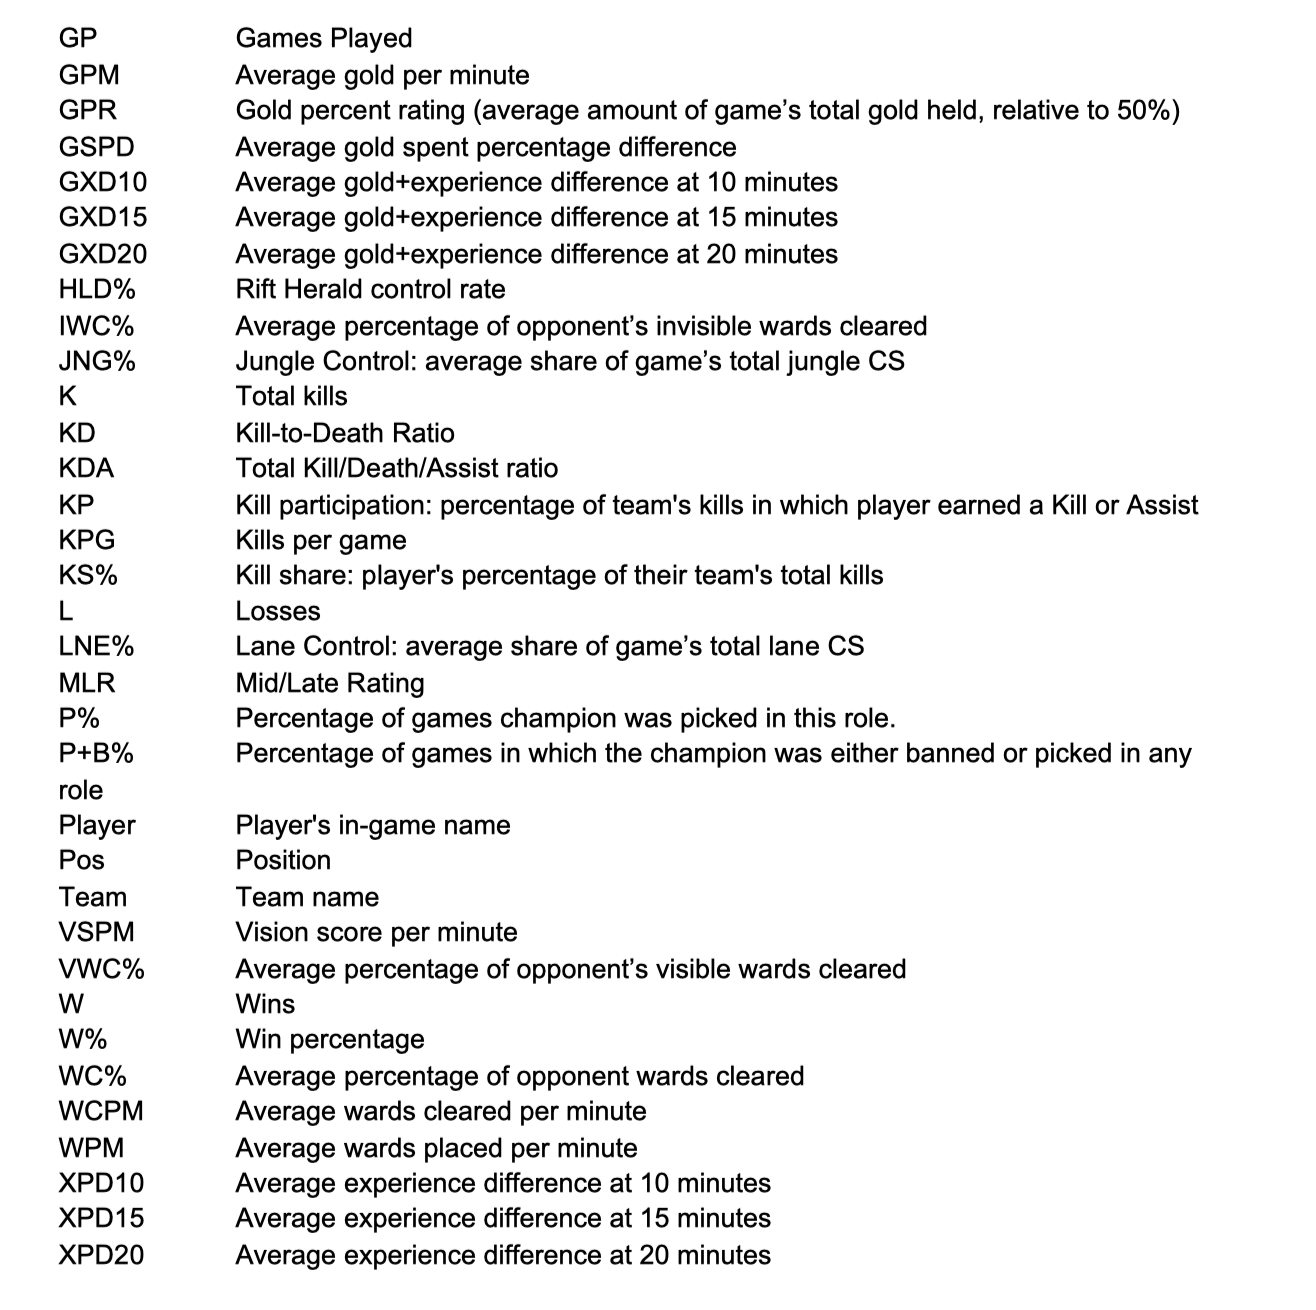
Variable Name Explanation